

Thriving Places Index
Where there is no accountability, there will also be no responsibility. ―Sunday Adelaja
👥 Serves: 26-40 people, 41+ people
🎚 Difficulty: Hard
⏳ Total time: 121-240 minutes
🥣 Ingredients: Teamwork, environmental understanding, 1–2 data analysts/mathematicians, strong networks for eased data collection
🤓 Wholebeing Domains: Bioempathy, Community, Positive Emotion
💪 Wholebeing Skills: Abundance, Bioinspiration, Collaboration, Ecosystem harmony, Equity, Fairness, Nature kinship, Non-extracting, Reciprocity

Thriving Places Index
📝 Description
An index for sustainable wellbeing.
The Thriving Places Index (TPI) is an innovative approach to understanding your community’s strengths and challenges and to determining whether there are the necessary conditions in place for people to thrive. To thrive, by definition, is to “prosper, excel, and succeed”. A thriving place, then, is a community where individuals feel supported and where their needs are met, in a sustainable manner.
The TPI was created by the Centre for Thriving Places in 2010 and primarily focuses on England and Wales. The team uses index indicators from data produced by established data agencies that focus on wellbeing, including the Office for National Statistics (ONS), Public Health England (PHE), and the Index of Multiple Deprivation (IMD). The TPI is a useful tool to determine what matters most in a community and to support changemakers to take tangible steps to establish a thriving community.
This recipe has been written by our wellbeing content writer collaborator Marissa Del Mistro.
👣 Steps
Step 1 – Understand the TPI framework (30’)
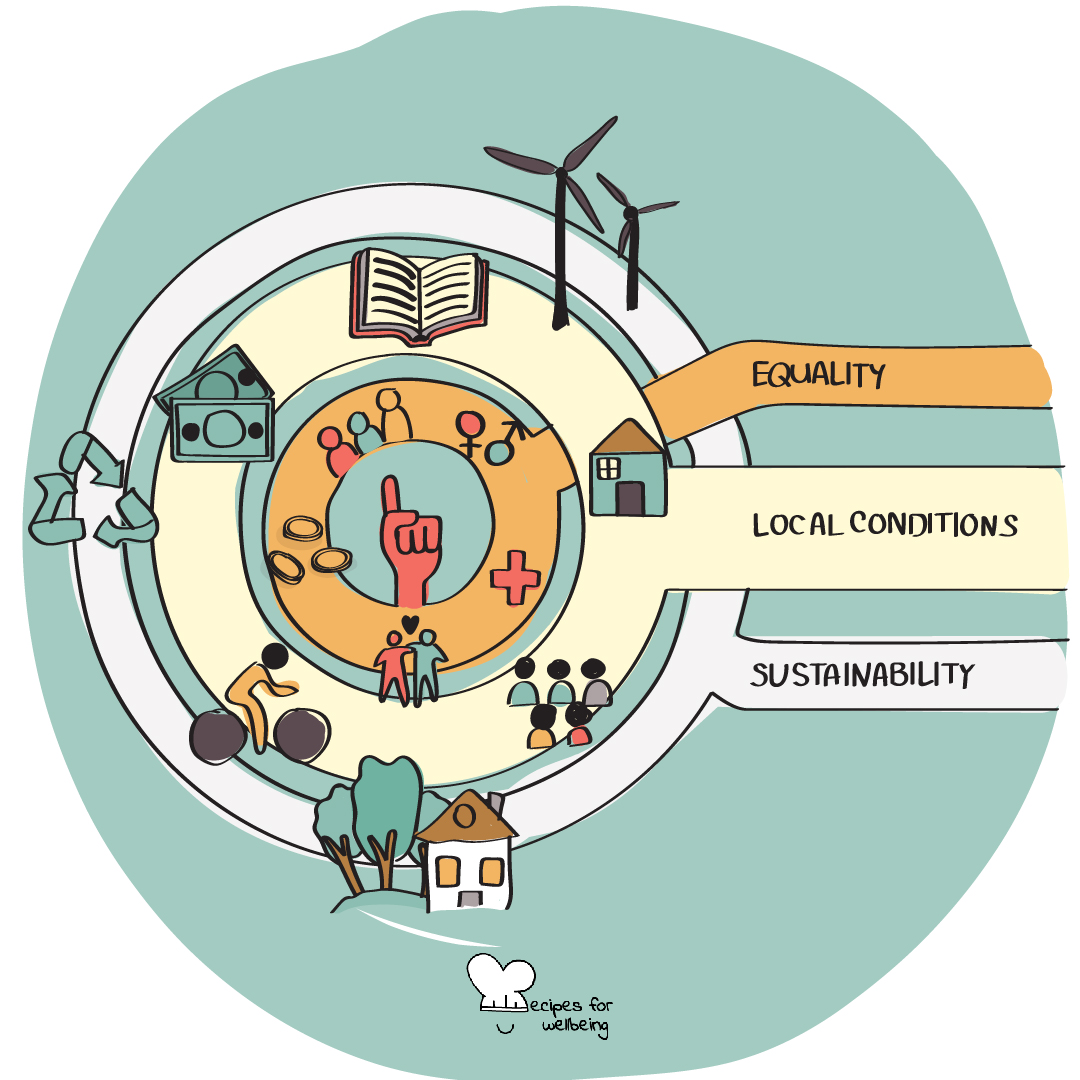
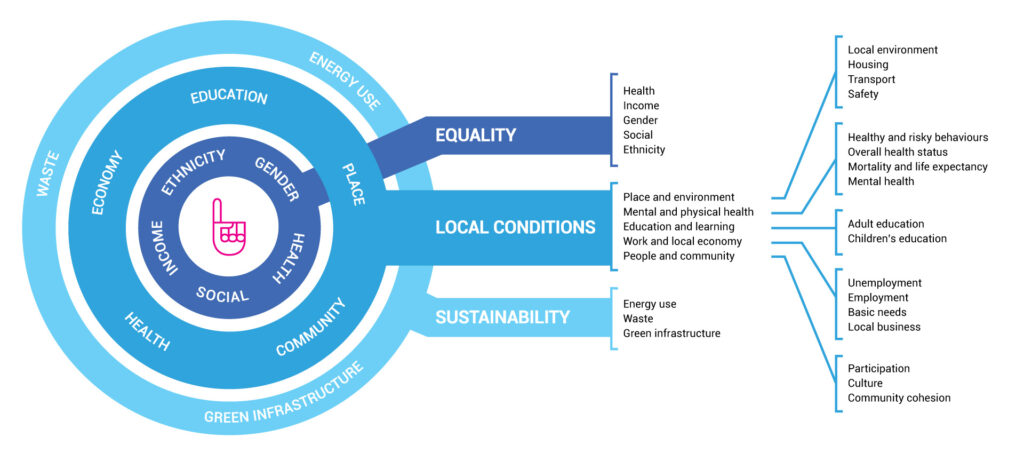
The TPI framework is broken into three main elements: local conditions, equality, and sustainability – all interrelated to one’s well being and ability to thrive. These three elements are then broken into sub-domains that are composed of a number of indicators which capture data on various aspects within that category.
This image, courtesy of The Centre for Thriving Places, shows the breakdown of each measurable element.
Step 2 – Calculate TPI scores (1 hour)
Time for your data analysts and mathematicians to step up!
- First and foremost, you will need to gather local data from sources such as health care, government, and other local community organisations.
- Second, you need to translate the raw data into consistent data sets. The TPI uses a score method of 0-10.
- Third, after gathering data for all indicators (refer to step 1), you need to standardise the raw data to ‘z-scores’ so that all indicator values have a mean of ‘0’ and a standard deviation of 1 to show the variability within a data set.
- Fourth, apply the equation: (Raw value minus national mean) divided by (standard deviation between different regions).
- Fifth, to avoid extreme values affecting the overall spread of scores, the z-scores are then capped at -5 and +5 so that z-scores below -5 become -5, and scores above 5 become 5.
- Sixth, for simplified interpretation of the scores, rescale the sub-domain, domain, and headline element values to fall on a 0-10 scale, with 5 representing the average national score for the current year. This is done using the following formula: Recalibrated = z ij + 5.
- Seventh, scores are capped at 0 and 10, so that any scores below 0 become 0, and scores above 10 become 10. The formula was designed to ensure a reasonable spread of scores between 0 and 10. With this formula, any variation beyond 3 standard deviations away from the mean is ignored.
Step 3 – Colour-code the scores (30’)
Make the data a little bit easier to read and understand.
The TPI uses a colour scheme for presenting the scores:
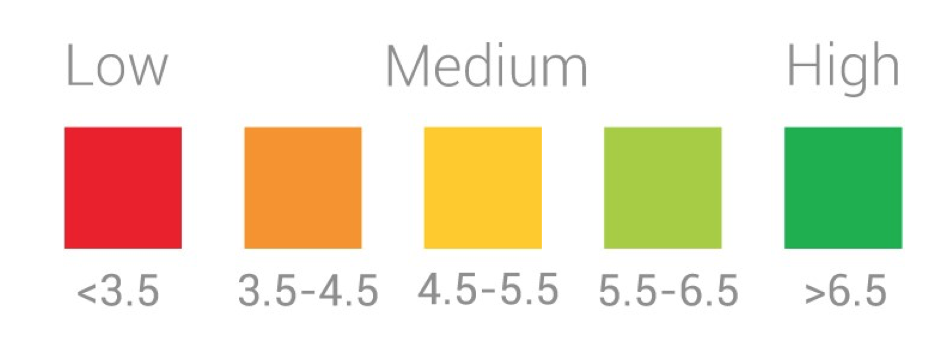
- Medium scores (4.5-5.5) are coloured yellow. This score demonstrates that the data in that category/domain/subdomain is the same as, or very similar to, the average score.
- Above or below average scores are coloured in pale green (5.5-6.5) and orange (3.5-4.5).
- Very high or very low scores are coloured in dark green (above 6.5) and dark red (below 3.5). These scores demonstrate data that is the furthest from the area’s average.
*Please note, the Centre for Thriving Place offers consulting services and is happy to support communities in data collection and report building.
Step 4 – Use the data (2 hours)
The data can help changemakers to work on the following in their community:
- Challenge the current understanding of how an area can grow in a way that benefits all, not just a lucky few while being mindful of the earth’s limited resources. Consider using our recipe on Community Wealth Building, which focuses on building an economic framework that values plural ownership or our recipe on Doughnut Economy, whose goal is to shift the current economic model from the traditional measurement of Gross Domestic Product to a focus on how economic prosperity should support human and natural wellbeing. Our recipe on Economic Democracy, which supports citizens having shared ownership of resources in their community and equal contribution in decision making can also be of use.
- Target local needs to determine what needs investment and focus and develop integrated, tailored wellbeing policies across and between sectors. Our Multidimensional Poverty Index can support your Thriving Places Index too by assessing how people experience poverty, and trends or patterns for similar groups of people by assessing non-income-based dimensions of poverty, for a more comprehensive evaluation of the extent of poverty and deprivation.
- Monitor local progress towards delivering equitable, sustainable wellbeing. Have a look at our Genuine Wealth recipe, which can help inspire towards measuring and managing the wellbeing and happiness of a community or organisation.
- Encourage responsible progress towards shared goals, which can be supported by our Happy Planet Index recipe, which measures sustainable wellbeing by ranking countries on how they use environmental resources and their contribution to wellbeing.
The TPI applies a holistic wellbeing approach that community leaders and changemakers can use to grasp how complex factors are interrelated when wanting to achieve a thriving place.The TPI highlights the need for a place-based understanding of wellbeing for policy and community programme design.
The TPI helps to measure the impact of new programmes, interventions, or policies in a robust and evidence-based way – increasing the chance of instilling sustainable, tangible change.