

Genuine Progress Indicator
Be loud about the things that are important to you. ―Karen Walrond
👥 Serves: 26-40 people, 41+ people
🎚 Difficulty: Hard
⏳ Total time: Half a day
🥣 Ingredients: Data analyst(s), open-mindedness
🤓 Wholebeing Domains: Bioempathy, Community, Liberatory Learning
💪 Wholebeing Skills: Accountability, Ecosystem harmony, Equity, Flourishing, Non-extracting

Genuine Progress Indicator
📝 Description
Utilise the GPI to determine holistic wellbeing of the economy.
The Genuine Progress Indicator (GPI) is a useful metric for community leaders and policymakers to form a deeper understanding of a community’s wellbeing by considering not only the economic situation, which is traditionally dominated by the Gross Domestic Product (GDP), but also social and environmental factors. The GPI was developed back in 1994 by Clifford Cobb, Ted Halstead, and Jonathan Rowe, building on the theories of green economics, which see the economic market as a segment of an entire ecosystem – as opposed to a stand-alone measurement of wellbeing. It implores three principles for measurements:
- Account for income inequality;
- Include non-market benefits; and
- Identify and deduct “negatives” such as environmental degradation, human health effects, crime, and loss of leisure time.
The GPI incorporates the costs and benefits overlooked by GDP but that have a significant bearing on the economic wellbeing of communities. Benefits include the “profits” households receive from the consumption of goods and services, as well as the goods and services governments and nonprofits supply. It also includes the benefits communities get from high-quality schools, modern/adequate infrastructure, protected natural areas, and social capital such as kindness, volunteering and helping our people in the community. Because the GPI increases if a community has more free time, greater equality, and a cleaner, healthier environment, it more accurately reflects changes in a community’s quality of life and wellbeing than GDP alone. Countries such as Canada and the USA use GPI in addition to the GDP for more accurate data.
A useful analogy is to consider the relationship between the GDP and the GPI like the relationship between the gross profit of a company and the net profit. The net profit is the gross profit minus the costs incurred. The GPI is the GDP (value of all goods and services produced) minus the environmental and social costs. Accordingly, the GPI will be zero if the financial costs of poverty and pollution equal the financial gains in the production of goods and services, with all other factors being constant.
This recipe has been adapted from the work of Clifford Cobb, Ted Halstead, and Jonathan Rowe and Simon Kuznet’s work which addressed how GDP cannot be an adequate measure of how a nation is faring overall. It was written by our wellbeing content writer collaborator Marissa Del Mistro.
👣 Steps
Step 1 – Understand the GPI (1 hour)
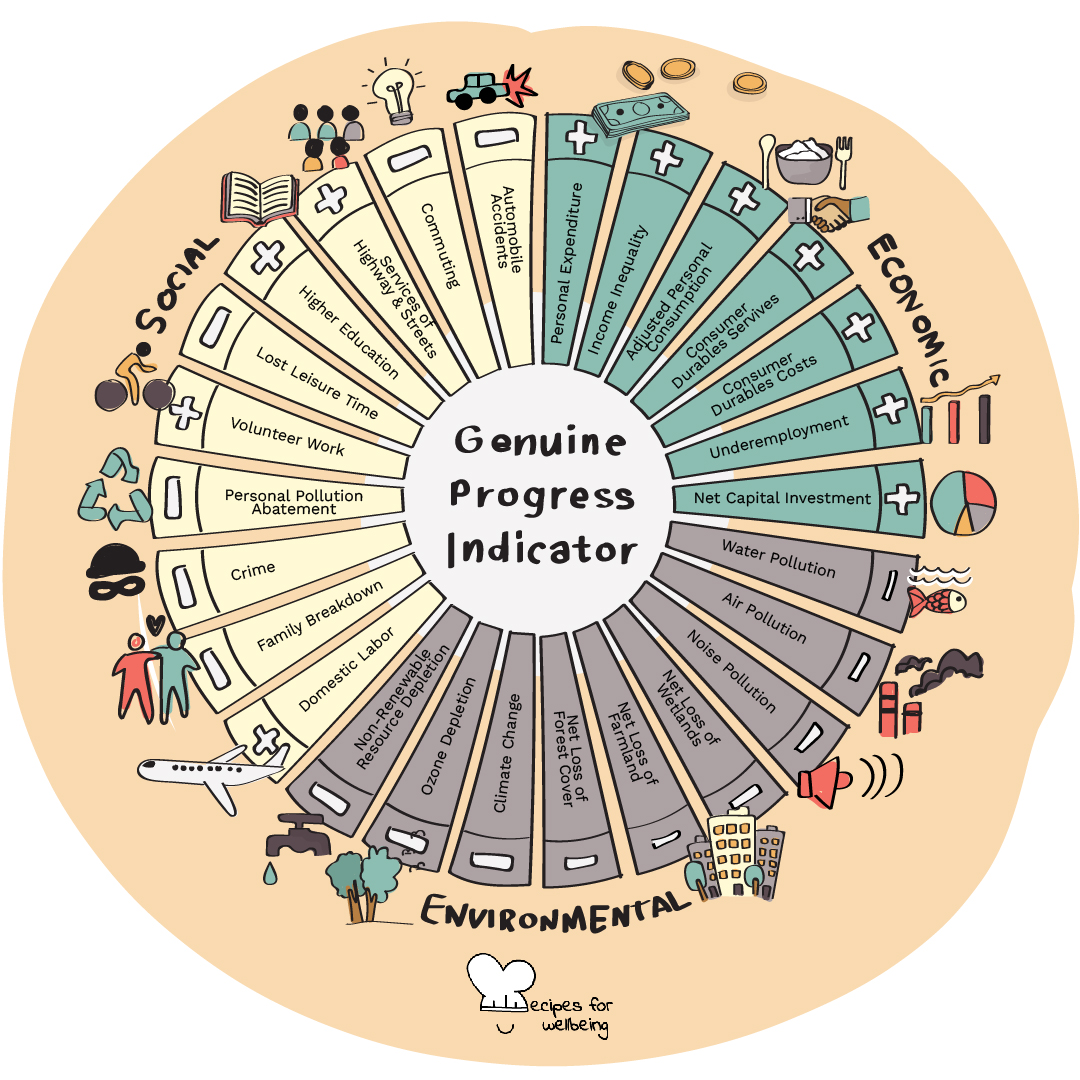
The GPI is made up of 26 indicators, related to welfare and sustainability, grouped into three categories: social, economic, and environmental. Each measures a different condition of the economy.
- Social: Examples of factors that negatively impact a community are crime, loss of leisure time, family breakdowns because they impose large economic costs on both individuals and the entire community – due to legal fees, medical expenses, damage to property, etc. These fees are accounted for in the GDP, so negative aspects, in monetary terms are considered growth and beneficial. The GPI strives to change that. Positive social factors include work that is done in household and community settings: childcare, home repairs, volunteer work, and the like. These positive contributions are ignored in the GDP, because no money changes hands. To correct this omission, the GPI includes, among other things, the value of household work figured at the approximate cost of hiring someone to do it.
- Environmental: Examples of factors that negatively affect the environment include any type of pollution to water, air, and noise pollution. It also looks at climate change, ozone depletion and net loss of farmland. Essentially, the GPI takes account of the depletion of natural capital, with the recognition that humans do not live in an economy, but in a society, and that the society itself is embedded in a natural environment, thus sustainable practices are imperative for success.
- Economic: Examples of factors that negatively affect a society are income inequality and under-employment. Higher unemployment tends to lend itself to a community with less economic stability, poor mental and poor physical health. The GDP strictly measures money, regardless of distribution as a positive. Yet, a dollar to a poor person produces more additional welfare than a dollar to a wealthy person. The GPI, however, accounts for distribution and paints a more accurate picture of welfare. The GPI also accounts for the positives, such as personal expenditure and net capital investments.
You may adapt some indicators to meet the specific needs of your community, but make sure this is done in agreement with everyone in the community.
Step 2 – The GPI equation (2 hours)
What you measure speaks of what is valued in your community. If you fail to count non-monetary and non-material assets, these will be devalued. For example, if a teacher explains that a research paper is “very important”, but it’s worth nothing towards the final grade, the students are likely to think that, in actuality, the research paper is of no value, and will instead devote their time and efforts to the final exam which “counts” towards something. Until communities value wellbeing aspects such as sufficient free time, volunteering, and natural resources, these will never be considered for adequate attention on the public policy agenda. Let’s see how the GPI works in real-time.
If you look again at the image provided in Step 1, you will notice the +/- symbols. This is a little hint towards the equation, as anything with a “–“ is subtracted and “+” is added. The GPI can be calculated with the following equation – which can be completed by the data analyst: GPI = Cadj + G + W − D − S − E – N
- Cadj is the personal consumption adjusted to account for income distribution.
- G is the growth in capital and net change in an international position.
- W it the non-monetary contributions to welfare (household labour, volunteer work).
- D is the defensive private expenditure.
- S is the depletion of social capital (cost of crime, family breakdown, lost leisure time).
- E is the cost of environmental degradation.
- N is the depletion of natural capital.
The GPI can be used to capture the costs of policies that degrade environmental policy, as well as the benefits of those that improve it, such as those that reduce the costs of pollution or those that reverse the depletion of natural capital through ecological restoration.
For example, if you consider an urban community, with plenty of growth and established companies – the economy, per the GDP, will see expansive growth. Yet, increased urbanisation can lead to increased commuting, increased traffic congestion, increased pollution, land use conversion,etc. A growing GDP does not mean the community is happy, thriving and living well. It also does not indicate that a community is operating sustainably. This is where the GPI can help a community grow sustainably and thrive.
Step 3 – The GPI benefits (ongoing)
Once determined, it’s important to report on the findings, to motivate communities and possibly other changemakers who are interested in a holistic approach. Ideally, these will be reported quarterly and/or annual when the traditional GDP figures are published, along with explanations and analyses of how the two measurements differ and implications for the long-term sustainability of a community’s economy.
Another way to showcase the GPI’s usefulness is to immediately incorporate it into the analysis of public policy. New laws, bills, policies, projects require decision-makers to quantify the economic impacts. Instead of quantifying these impacts in traditional terms, with GDP, communities can instead address impacts from the broad sustainability perspective from the new information gathered from the GPI.
For inspiration on how to support your community through altruistic acts that do benefit a community, check out our recipe “Cultivate a Core Economy” or our recipe “Economic Democracy”, which focuses on sustainable, shared ownership of resources in a community and equal contribution to decision making.